Semiconductor fabrication
GaAs LED fabrication
Fabricating GaAs-based LEDs and connecting cleanroom process quality to electrical behavior and near-infrared emission.
From an epitaxial wafer to a working LED
This project covered the fabrication and characterization of GaAs LEDs. The starting material was an existing layer structure grown by molecular beam epitaxy. Photolithography, metallization, wet etching, and passivation were combined with electrical and optical measurements. These measurements were used to examine how processing affected current injection, current spreading, and light emission.
The contact geometry involves a tradeoff. Closely spaced metal fingers improve current distribution but cover more of the emitting surface. Wider spacing leaves more area for light extraction but increases the risk of current crowding and uneven emission. The device layouts used different finger counts and pitches to explore this balance.
The semiconductor structure
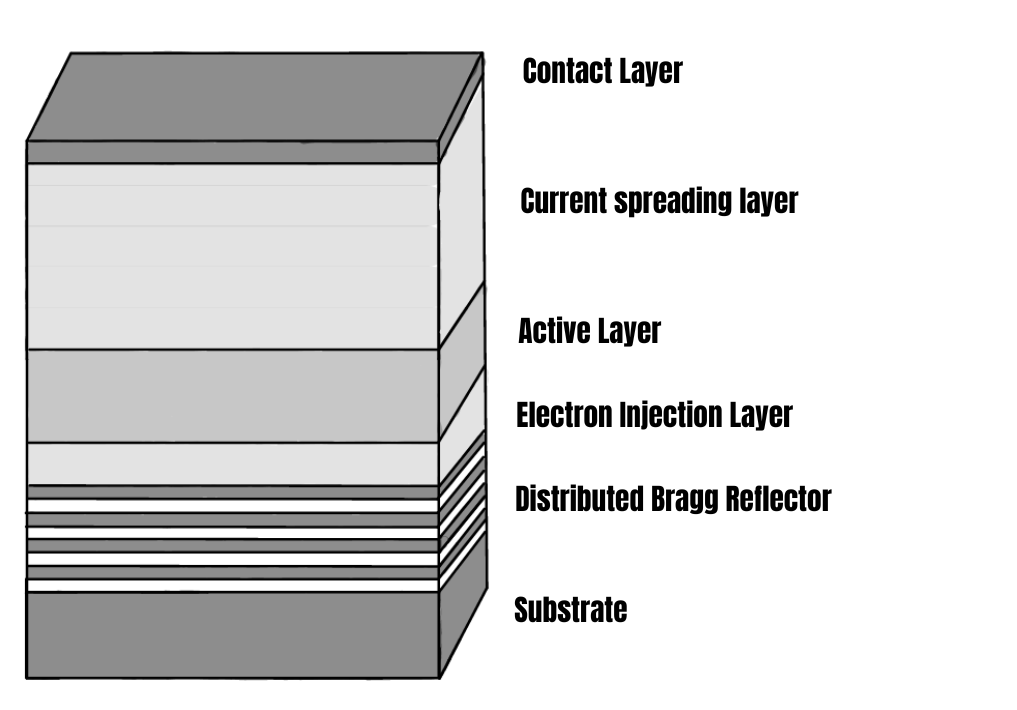
The starting stack consisted of a GaAs substrate, a distributed Bragg reflector (DBR), an electron injection layer, an active AlGaAs layer, a current spreading layer, and a thin GaAs contact cap. The DBR contained ten pairs of alternating AlAs and GaAs layers. The cap allowed metal contacts to be formed on the surface, but had to be removed between the contacts to reduce optical absorption.
Defining contacts, mesas and bonding pads
Digital masks were exposed using the MLA100 maskless lithography system. Silicon and GaAs dummy samples were used to test lithographic doses and etch rates before processing the LED sample. Negative ma-N 440 resist was used to create an undercut profile, so that the deposited metal could be lifted off cleanly. SEM inspection was used to check the resist sidewalls.
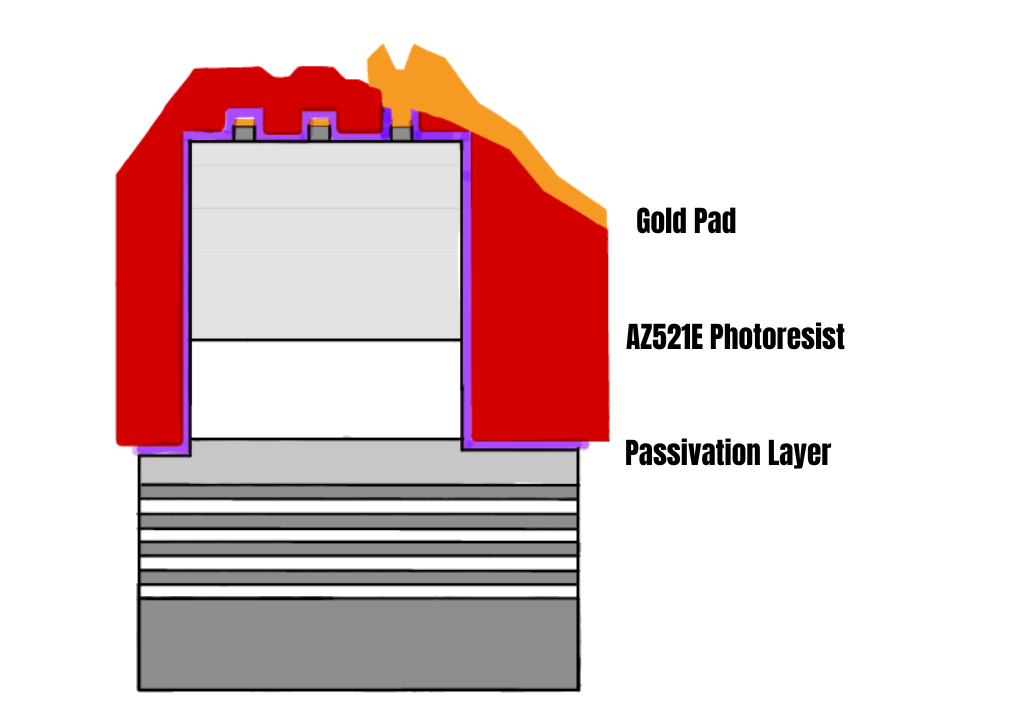
After the front contacts were formed, wet etching removed the exposed GaAs cap and defined mesas to electrically isolate the devices. Profilometry measured approximately 100 nm of cap removal. The mesa etch reached 3.4 µm against a 3.2 µm target, exposing DBR layers visible as red fringes under optical microscopy.
A silicon nitride passivation layer was deposited by PECVD and measured at 255 nm. Rapid thermal annealing supported ohmic contact formation. A thick AZ 5214E resist layer then provided planarization. Openings through the passivation allowed the final titanium/gold bonding pads to connect to the busbars.
Electrical behavior and current spreading
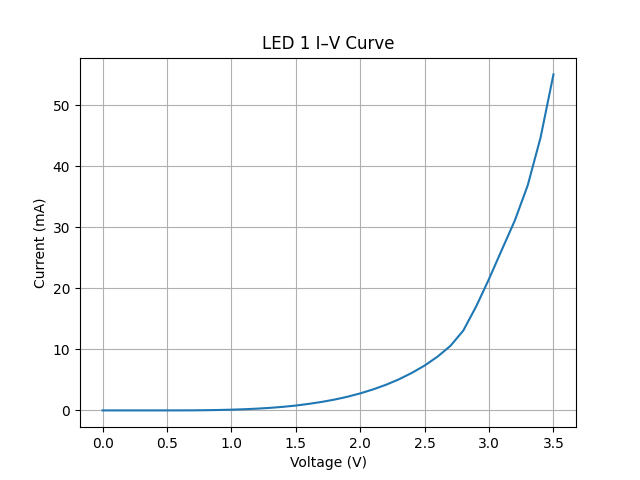
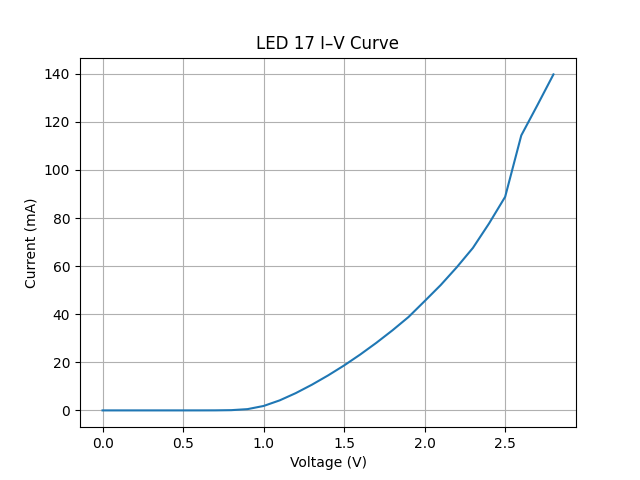
All tested devices showed rectifying behavior, but the forward voltage and achievable current varied considerably. In the recorded sweep, LED 17 reached roughly 100 to 140 mA between 2.5 and 2.7 V. LED 1 remained below approximately 60 mA even near 3.5 V, consistent with a higher series resistance.
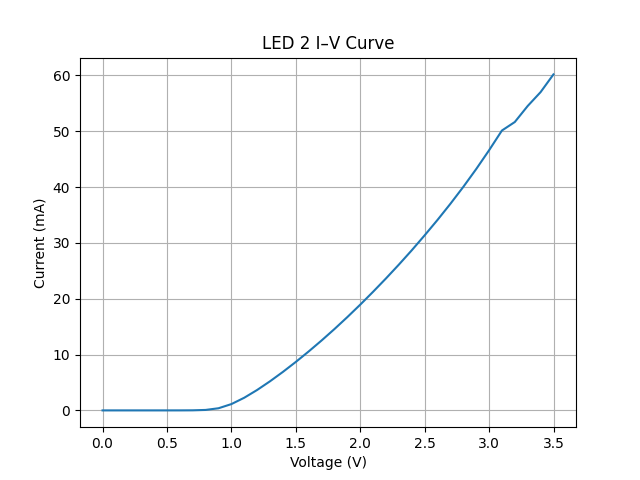
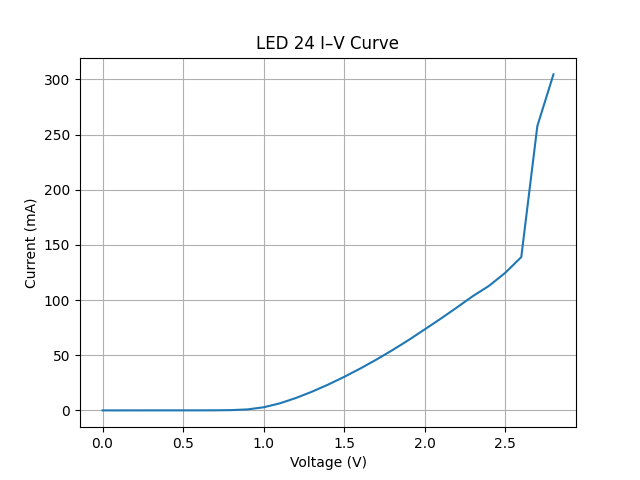
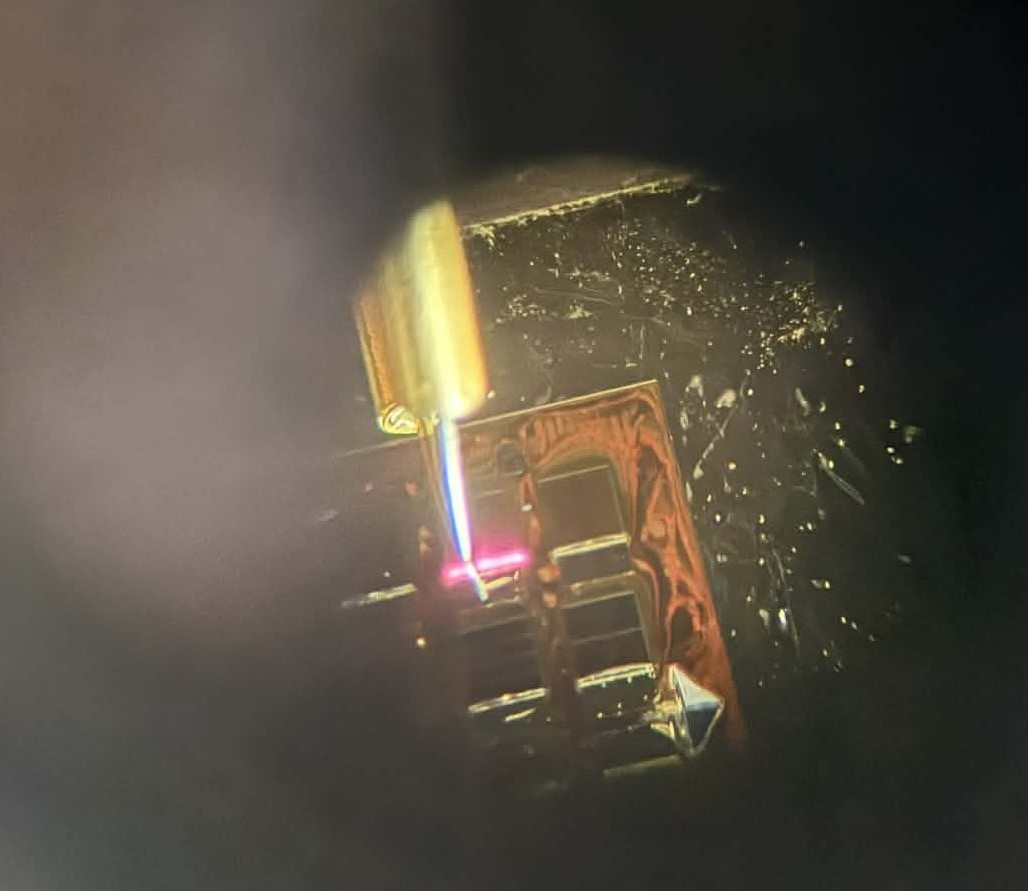
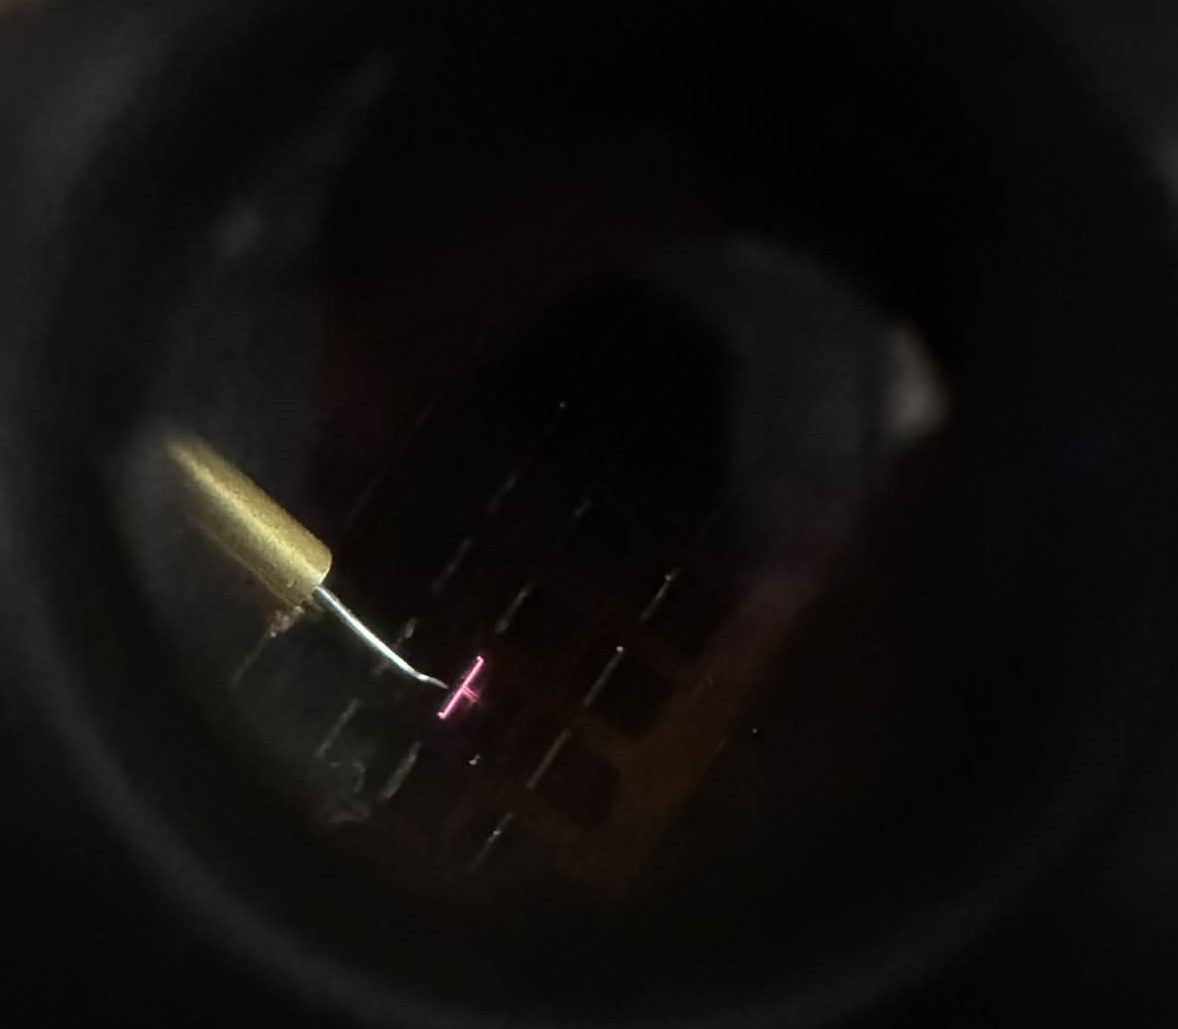
In a separate measurement at higher current, LED 2 exceeded 500 mA at approximately 2.7 V. Optical inspection showed light concentrated near the probe contact rather than distributed uniformly across the device. Incomplete resist removal and local variations in contact resistance are possible causes of the uneven current spreading. Neither was conclusively established.
Measuring the emitted light
The emission spectrum of LED 17 was calibrated using a 635 nm reference laser and a dispersion of 0.3304 nm per detector pixel. The calibrated spectrum showed a peak near 798 nm and a full width at half maximum of approximately 31 nm. This places the dominant emission just beyond the red end of the visible range, in the near infrared.
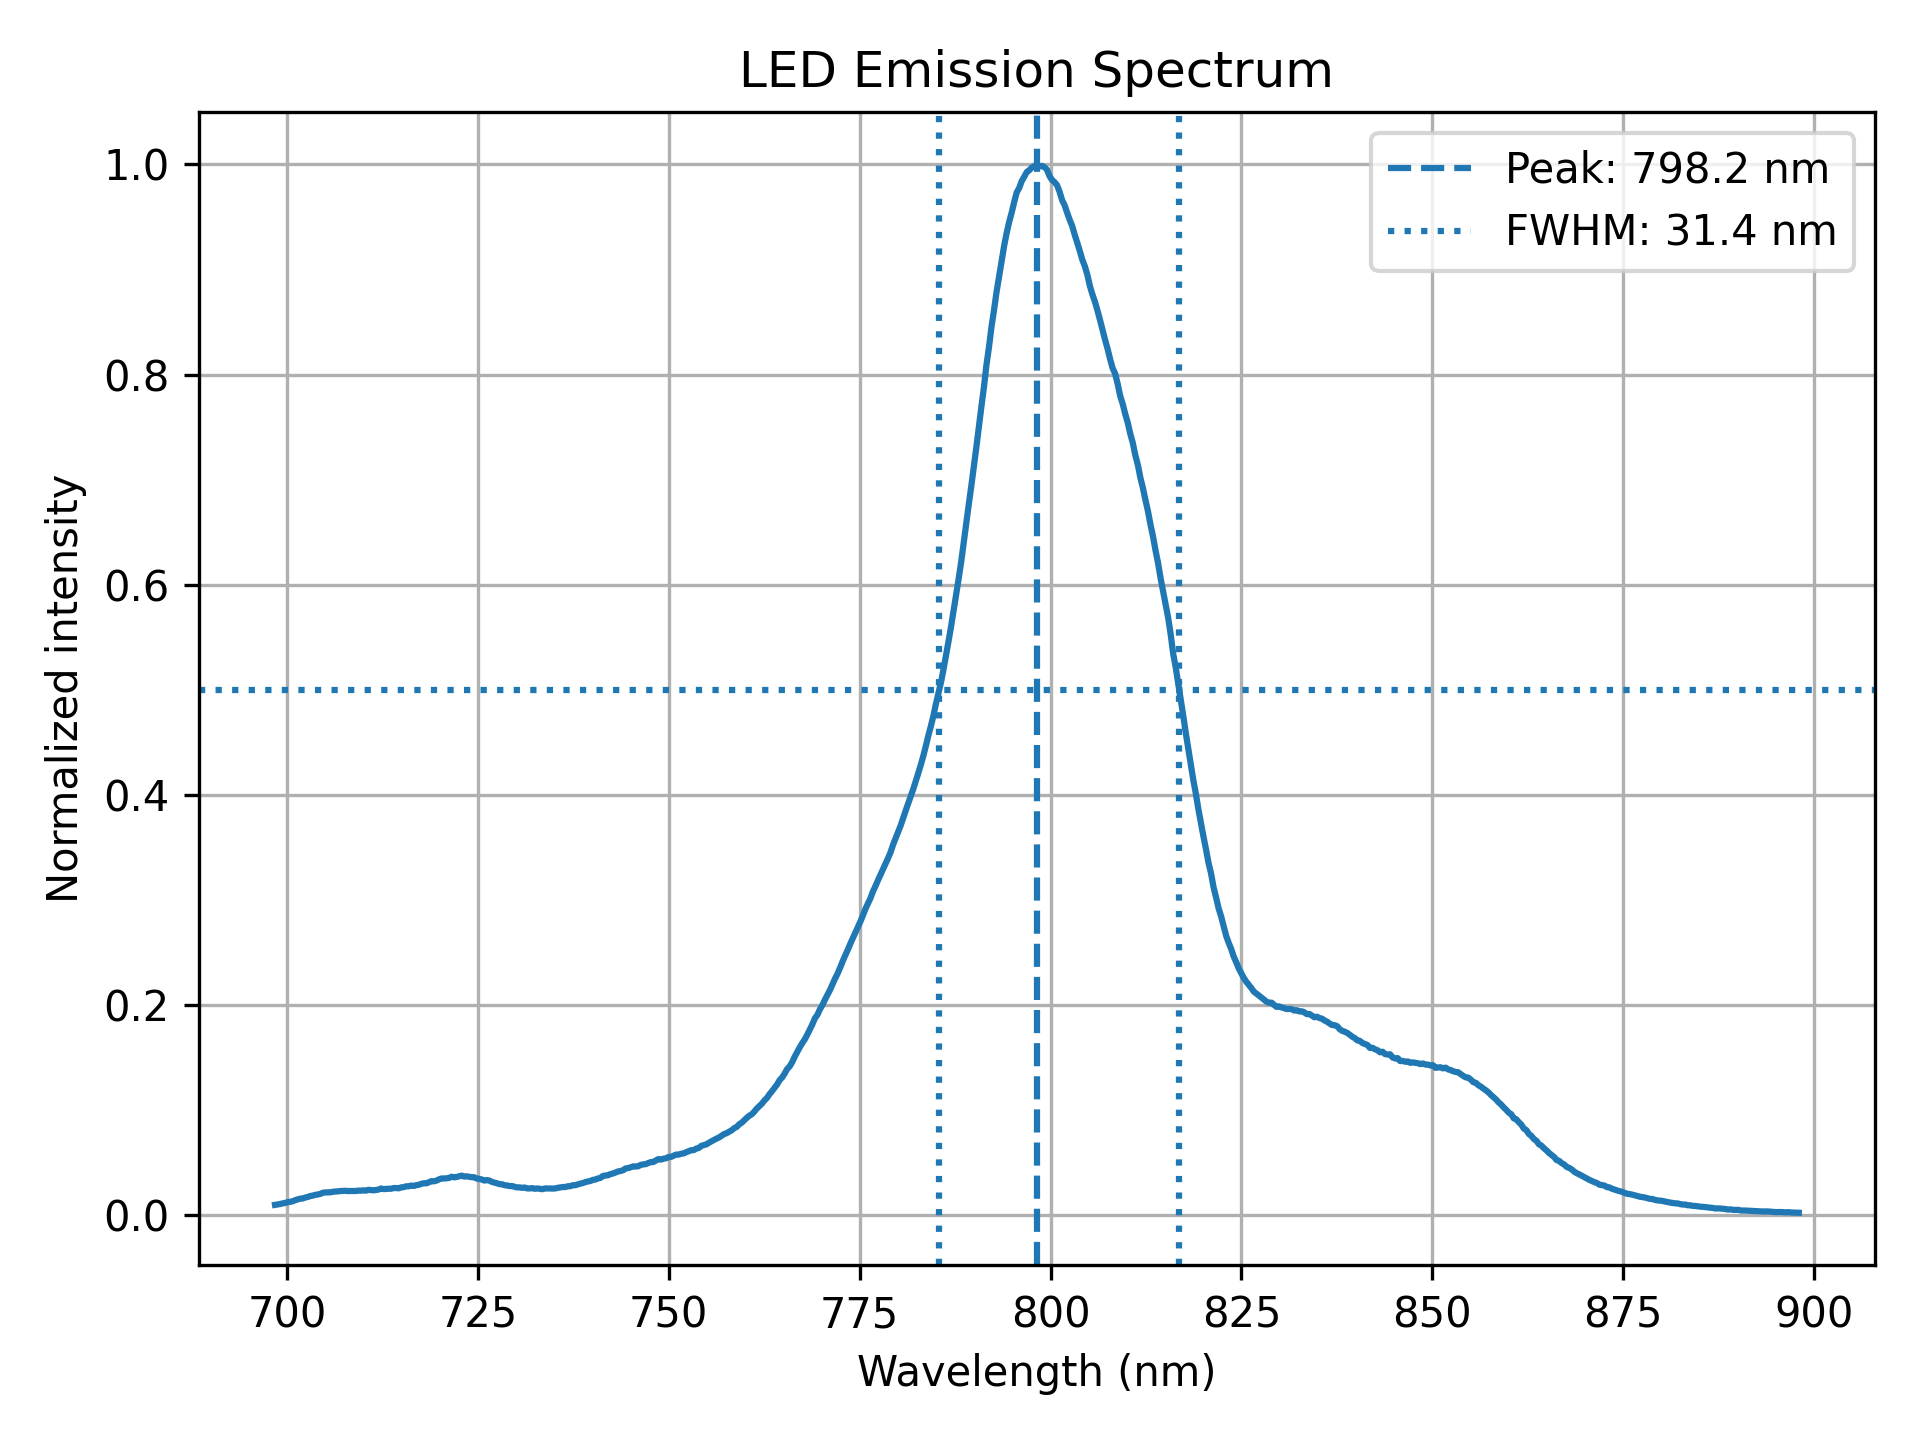
Because the peak lies outside the visible range, the emission could appear weak to the eye despite a clear spectrometer signal. Spectrometer wavelength stability limited the absolute calibration accuracy. The spectrum therefore supports a qualitative characterization rather than a precise wavelength measurement.
What the project showed
The fabricated devices showed diode behavior and electroluminescence. They also showed how sensitive device performance is to processing. Excess mesa etch depth, contact resistance, and uneven current spreading link the fabrication observations to the electrical and optical results. Improving etch control and contact uniformity would be the next priorities for more consistent device performance.